(a nasty combination)
When using ASP.NET 3.5 AJAX extensions in a web application, server errors that are thrown within an UpdatePanel request are hard to debug - even "hard to visualize". All you get, if you are lucky (*) is something like this:
(*) NOTES:
- The actual message may vary depending on your browser.
- This option to debug will only show if you've selected "debug javascript" in the browser options, otherwise you'll only get an error icon somewhere in the screen.
Debugging with Visual Studio 2008
Assuming you have Visual Studio available, I'll show how to get to the actual server error information with the IDE debugger. If you do not, you may follow a similar procedure with the built-in IE 8.0 debugger, or another "javascript-enabled" debugger of your choice.
- If the error is thrown when you are not running the web application in debug mode from the VS IDE, a message similar to the previous image will appear. Clear the "built-in debugger" checkbox, answer "Yes", and choose to debug in Visual Studio 2008.
- If you've started the web application in debug mode from the VS IDE, you will be taken to the exception code directly (no message box)
In either case, you'll be looking at something like this:
After selecting "Break", you may get the actual HTML of the server error in two ways:
- Paste the following expression in the Watch window:
_this._webRequest._executor._xmlHttpRequest.responseText
or
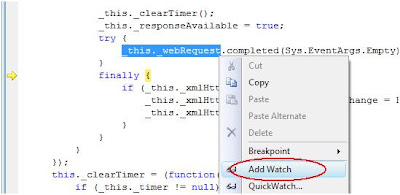
- Select "_this._webRequest" in the code window, add it to the Watch window, and expand the expression as shown below.
In either case, the final step (in VS 2008) is to select the "HTML Visualizer" to look at the server response in a human-readable format.
Step by step instructions:
Add _this._webRequest to the Watch window

Expand the expression and select the HTML Visualizer
You'll get something like this:


1 comment :
Don't use Ajax UpdatePanel!!!! :-)
Post a Comment